Archive for the ‘software’ Category
Monday, April 16th, 2012
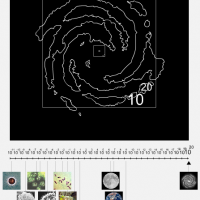 Bajo este nombre críptico habrá un taller en el Festival Internacional de la Imagen en Manizales/Colombia. El taller tiene como objetico familiarizar a los participantes en la programación JavaScript/HTML5 utilizando los ejemplos “De Gaia al microcosmos” como base práctica. La primera parte del taller será una introducción práctica al elemento Canvas de HTML5 y a las capacidades y particularidades de Processing para la programación web. En la segunda parte se formaran grupos de los cuales cada uno analizará uno de los 7 ejemplos de GAIA o uno de sus componentes comunes.
El proyecto “De Gaia al microcosmos” busca transformar, actualizar y localizar culturalmente materiales educativos desarrollados por Lynn Margulis mostrando interrelaciones biológicas y geológicas que ocurren desde el universo molecular al universo cósmico. Ha sido iniciado en el 2005 por Lynn Margulis, Santiago Ortiz y Luis Rico.
Como siempre podrás encontrar los apuntes del taller en mi wiki educativo.
Tags: gaia, HTML5, javascript, Lynn Margulis, processing.js, processing.org
Posted in artprojects, education, software | No Comments »
Sunday, February 26th, 2012
Recently I converted some Processing sketches to Processing.js using Processing 2.0a4 Pre-Release with integrated Javascript mode. In resume it’s quite straight forward, they did a great job. But I had some troubles with code that works fine in Processing but not when exported to Javascript.
Sometimes it’s quite hard to detect errors yet the applet gets exported without error messages and shows up in the browser as an empty canvas. It’s recommended to use Firebug and Chrome javascript console Javascript console in parrallel as sometimes one gives a better description than the other. But sometimes none of them shows an error so it’s quite impossible to debug the sketches. (more…)
Tags: javascript, processing.js, processing.org
Posted in software | 7 Comments »
Wednesday, October 5th, 2011
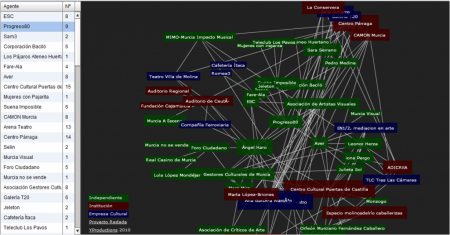
Last year I developed a graph visualization for my colleges from YProductions. Since then they used it for their projects of mapping cultural agents in different cities like Alicante and Murcia.
Now we published the sources of the flex project on Github under GPLv3 license. The code is written in Actionscript3 based on flare library. Data is read from an external GraphML file so if you want to publish your own graph just create an XML file based on your own data.
You can find more information on the wiki.
Tags: flare, FLOSS, github, GPL, graph, infovis, redada, YProducciones
Posted in software | No Comments »
Monday, June 27th, 2011
Preparing a workshop on teaching artists how to make their own web site I noticed the need for a video plugin for indexhibit. So I put together a small plugin for making it really easy to publish videos inside indexhibit.
Inspired by this post I put together the files necessary for a quick and dirty JW Player plugin. It includes player.swf from JW Player, swfobject and an indexhibit plugin file.
(more…)
Tags: aavc, hangar, indexhibit, portfolio
Posted in education, software, webdesign | 29 Comments »
Thursday, March 17th, 2011
jabberlib is a Processing library that encapsulates the SMACK API, an “Open Source XMPP (Jabber) client library for instant messaging and presence”. I startet development as part of the Time Inventors’ Kabinet (TIK). TIK is an art project interested into ecology and media art, a collaborative experiment with time. jabberlib is based on SMACK as our TAK server relies on the XMPP pubsub service.
The current version 0.2 is really basic and more like a proof of concept for using SMACK as XMPP client with Processing. Documentation, examples and download from here.
Tags: jabber, openfire, processing.org, SMACK, TIK, XMPP
Posted in artprojects, software | No Comments »
Monday, May 10th, 2010
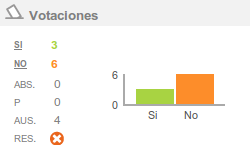 Durante los últimos tres meses estuve trabajando para votainteligente, una ONG que busca informar a la ciudadanía y fomentar la accountability sobre los políticos chilenos. Estuve desarrollando una aplicación de monitoreo parlamentario que explica y valora las actividades de los diputados y senadores.
Tags: chile, Fundación Ciudadano Inteligente, infovis, opendata, protovis, symfony, transparencia, votainteligente
Posted in software, webdesign | No Comments »
Friday, March 5th, 2010
Una semana pasó desde el terrible terremoto en Chile y seguimos con replicas. La siguiente gráfica muestra la cantidad y magnitud de todos los terremotos en Chile desde aquel 27 de febrero 2010.
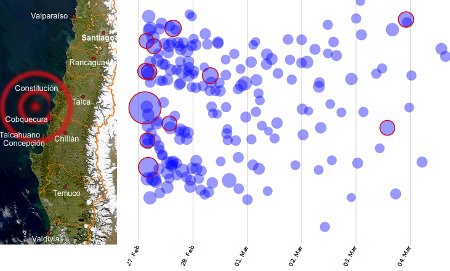
Aquí esta la versión interactiva (hecho con Protovis), mueve el ratón sobre los círculos y verás hora, lugar y magnitud de cada uno de los más de 200 replicas con magnitudes entre 4.9 y 6.9 según la escala de Richter.
Tags: chile, infovis, protovis
Posted in software | 2 Comments »
Tuesday, February 2nd, 2010
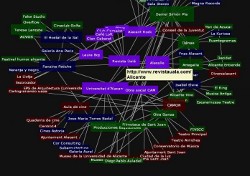 After using prefuse library and Processing for graph visualization a new project gave me the chance to try flare, the translation of prefuse to Actionscript.
My colleges from YProductions are investigating who are the principal persons, collectives and institutions in Alicante cultural live. The project is called redada and I made a social graph (lightweight version) of their results of investigation. First impressions: Good API design and quite stable for a alpha release.
There are still some improvements to be made in my application but if you want to make your own experiments you can start with this basic example, download Flex Project here.
Tags: flare, graph, infovis, redada, YProducciones
Posted in software, webdesign | 4 Comments »
 Bajo este nombre críptico habrá un taller en el Festival Internacional de la Imagen en Manizales/Colombia. El taller tiene como objetico familiarizar a los participantes en la programación JavaScript/HTML5 utilizando los ejemplos “De Gaia al microcosmos” como base práctica. La primera parte del taller será una introducción práctica al elemento Canvas de HTML5 y a las capacidades y particularidades de Processing para la programación web. En la segunda parte se formaran grupos de los cuales cada uno analizará uno de los 7 ejemplos de GAIA o uno de sus componentes comunes.
 Durante los últimos tres meses estuve trabajando para


