Processing Ring Chart
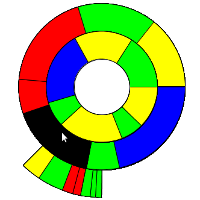
 I was always a big fan of Ring Charts, also known as Multi-level Pie Charts or Radial Treemap, specially the Baobap disk allocation program for Linux, developed by Igalia. Now I want to start to use them for other kind of visualizations as an alternative to treemaps. I didn’t find any implementation in Javascript so I started to develop one on my own using Processing and it’s Processing.js exporter. The design of the classes was inspired by this Java Ring Chart implementation.
Some characteristics of this class: It’s size and the thickness of the rings adapt dynamically to the container. The rings can start and end at any angle. The segments of each ring are divided proportionally based on the segments value and drawn to the proper arc length based on the start and end angle.
You can download the sources at OpenProcessing, what follows is a description of the classes ArcSegment, Ring and RingChart.
The ArcSegment Class
ArcSegment is the basic shape which consists of 2 arcs and 2 lines connecting them. As there is no easy fill method I just paint an ellipse over the inner element. To draw the lines for connecting the arcs I used a PVector and Shiffmans method to rotate the PVector object. To detect a mouseOver I used the mag() and angleBetween() functions of PVector.
class ArcSegment {
  float centerx, centery, radius, arcwidth, arcstart, extent, left, top;

  ArcSegment(float centerx, float centery, float radius, float arcwidth, float arcstart, float extent) {
    this.centerx = centerx;
    this.centery = centery;
    this.radius = radius;
    this.arcwidth = arcwidth;
    this.arcstart = arcstart;
    this.extent = extent;
    this.left = centerx - radius;
    this.top = centery - radius;
  }

  //source: http://www.shiffman.net/2011/02/03/rotate-a-vector-processing-js/
  void rotate2D(PVector v, float theta) {
    float xTemp = v.x;
    v.x = v.x*cos(theta) - v.y*sin(theta);
    v.y = xTemp*sin(theta) + v.y*cos(theta);
  }

  boolean mouseOver() {
    PVector v = new PVector(mouseX-centerx,mouseY-centery);
    PVector v0 = new PVector(radius/2,0);
    float mouseAngle = degrees(PVector.angleBetween(v, v0));
    float mouseLength = v.mag();
    if (mouseY < centery) mouseAngle = 360-mouseAngle;
    return (mouseLength > radius-arcwidth && mouseLength < radius && mouseAngle > arcstart && mouseAngle < arcstart+extent);
  }

  void draw() {
    //outer arc
    arc(left, top, 2 * radius, 2 * radius, radians(arcstart), radians(arcstart+extent));

    //inner arc
    fill(255);
    ellipse(left + arcwidth, top + arcwidth, 2 * radius - 2 * arcwidth, 2 * radius - 2 * arcwidth);
    noFill();
    arc(left + arcwidth, top + arcwidth, 2 * radius - 2 * arcwidth, 2 * radius - 2 * arcwidth, radians(arcstart), radians(arcstart+extent));

    //lines to connect arcs
    PVector v = new PVector(radius/2,0);
    rotate2D(v,radians(arcstart));
    line(centerx+v.x,centery+v.y,centerx+v.x*2,centery+v.y*2);
    rotate2D(v,radians(extent));
    line(centerx+v.x,centery+v.y,centerx+v.x*2,centery+v.y*2);
  }
}
The Ring Class
This class will create a ring based on the start and end points. It will take a value, a label and a color for each segment of the ring and divide them accordingly based on the values. The Value, Label and Color ArrayLists are set in the Ring class and the ring is created by creating the segments. Each Ring contains the start angle, end angle and the values.
class Ring {
  ArrayList<String> Labels;
  ArrayList<Float> Values;
  ArrayList<Integer> Colors;
  float x, y, radius, ringwidth, ringstart, ringend;
  ArcSegment[] segments;

  Ring() {
    Labels = new ArrayList();
    Values = new ArrayList();
    Colors = new ArrayList();
    this.ringstart = 0;
    this.ringend = 360;
    this.segments = null;
  }

  void setStart(float ringstart) {
    this.ringstart = ringstart;
  }

  void setEnd(float ringend) {
    this.ringend = ringend;
  }

  int count() {
    return Values.size();
  }

  String getLabel(int index) {
    return Labels.get(index);
  }

  color getColor(int index) {
    return Colors.get(index);
  }

  void setCenter(float x, float y) {
    this.x = x;
    this.y = y;
  }

  void setRadius(float radius) {
    this.radius = radius;
  }

  void setRingWidth(float ringwidth) {
    this.ringwidth = ringwidth;
  }

  void addItem(String label, float val, color col) {
    Labels.add(label);
    Values.add(val);
    Colors.add(col);
  }

  ArcSegment getSegment(int index) {
    return segments[index];
  }

  void createSegments() {
    segments = new ArcSegment[Values.size()];
    float sum = 0;
    float span = this.ringend - this.ringstart;
    for (int i=0; i<Values.size(); i++) {
      sum += Values.get(i);
    }

    float strt = this.ringstart;
    for (int i=0; i<Values.size(); i++) {
      float extent = (Values.get(i) / sum) *span;
      ArcSegment segment = new ArcSegment(this.x, this.y, this.radius, this.ringwidth, strt, extent);
      this.segments[i] = segment;
      strt += extent;
    }
  }

  void draw() {
    for (int i=0; i<segments.length; i++) {
      if (segments[i].mouseOver()) {
        fill(0);
        text(Labels.get(i),20,20);
      }
      else fill(Colors.get(i));
      segments[i].draw();
    }
  }
}
The RingChart Class
The RingChart Class puts it all together, it’s the class that will be called from the application. It takes a ArrayList of type Ring and does all the rendering looping through the draw() method of each ring and and each of their segments.
class RingChart {
  ArrayList<Ring> rings;

  RingChart() {
    rings = new ArrayList();
  }

  void setRings(ArrayList<Ring> rings){
    this.rings = rings;
  }

  void draw() {
    //draw from bigger to smaller rings
    for (int r = rings.size()-1; r >= 0; r--) {
      Ring ring = rings.get(r);
      float rw = (min(width,height) / (rings.size()))/2 - 20;
      ring.setRingWidth(rw);
      ring.setRadius(2*rw + rw*r);
      ring.setCenter(width/2, height/2);
      ring.createSegments();

      for (int index = 0; index < ring.count(); index++) {
        ring.draw();
      }
    }
  }
}
You can download the full sources, including the example shown above, at OpenProcessing.
Finally here is the Ring Chart using Processing.js. Because of performance issues it’s just a static version without redrawing and therefor without mouseover detection:
Tags: infovis, javascript, Multi-level Pie Chart, processing.js, processing.org, radial treemap, ring chart, rings chart
