Customizable vector map for visual impaired ppl
As part of my Bachelor Thesis I investigated accessibility for digital maps from the angle of visual impairment. Taking advantage of characteristics of vector maps, one of the results is a highly customizable map.
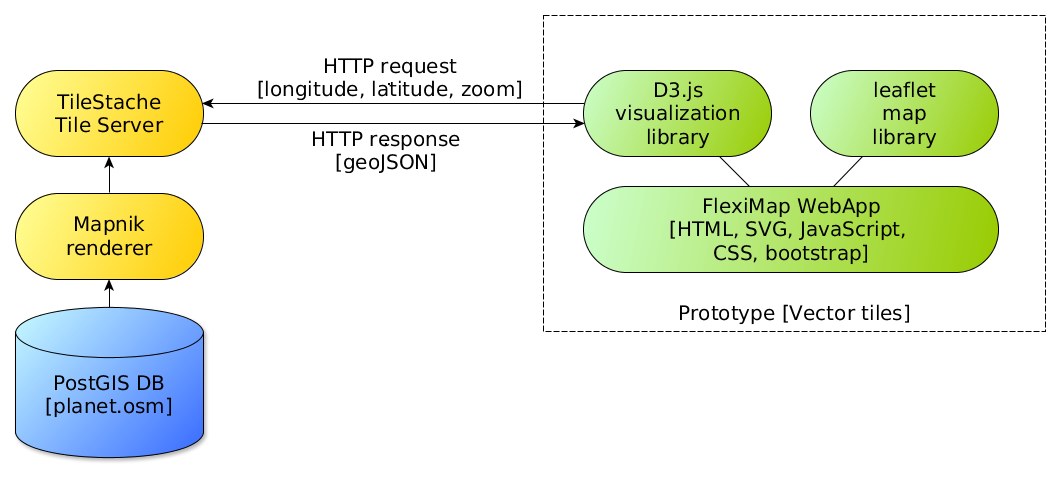 Instead of using pre (server) rendered raster images, the browser itself takes care of rendering vector data which represents the features in the tile. For example roads are sent as LineStrings, buildings, land and water as Polygons and POIs as Points. Javascript based on vector-osm converts them to SVG, the browser takes care of the rendering. Vector tiles are coming from Mapnik Vector Tiles in GeoJSON format using OpenStreetMap as data provider.
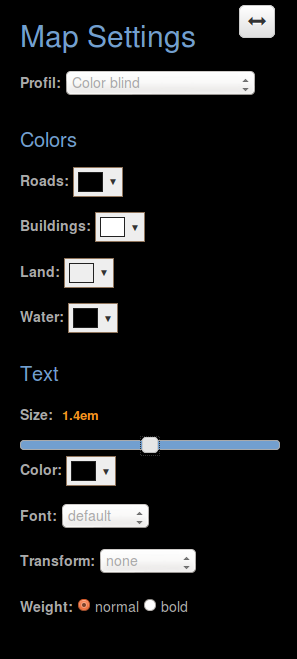 I developed two types of target profiles, one for the most common types of color blindness (see illustration) and another for strong visual impairment using hight contrasts. Furthermore the user can customize parameters like colors of features and text properties. Finally a textual representation of geodata, like streets and description of POIs, is offered as a list so it can be easily accessed by screen readers.
A working demo (alpha!) can be tested here, code is on github.
Tags: accessibility, color blind, mapping, osm, SVG, vector map, visual impairment
