Posts Tagged ‘mapping’
Monday, July 4th, 2016
The Historic Charter of Barcelona is a tool to explain the history of the city through the cartographies that describe it. It contains 26 maps that have been drawn from texts, historical cartographies, archaeological maps, modern cartography and contemporary digital maps. A committee of historians specialized in the various historical eras have cross-checked and corrected the documents under the direction of the Barcelona City History Museum (MUHBA).
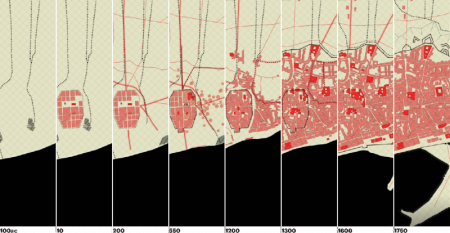
The project was done by 300.000 km/s, my part was the configuration of the mapping server and the programming of the web front end. The backend consists of Mapnik rendering map tiles which get served by TileStache. On the frontend we are running OpenLayers using raster tiles but also geojson layers. (more…)
Tags: 300000kms, Barcelona, history, javascript, Mapnik, mapping, MUHBA, openlayers, TileStache
Posted in education, maps, software | No Comments »
Friday, February 5th, 2016
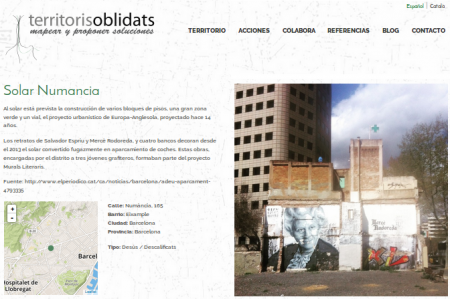
Territoris Oblidats trabaja la sostenibilidad y la accesibilidad urbana. Quiere repensar el diseño urbano para el uso de las personas. Su web presenta experiencias de áreas en desuso en Barcelona, a través de este formulario se puede anadir nuevos territorisos. La web y el backend del mapa estan basada en WordPress, el mapa utiliza Leaflet.js.
Tags: crowdsourcing, leafletjs, mapping, wordpress
Posted in maps, software, webdesign | No Comments »
Thursday, June 12th, 2014
Utilizando los scripts desarrollados para Barris i Crisi, monté un mapa de recursos para la Fundación Marianao en Sant Boi de Llobregat. El mapa muestra los recursos del barrio clasificado por diferentes categorías como educación, social o salud y bienestar.
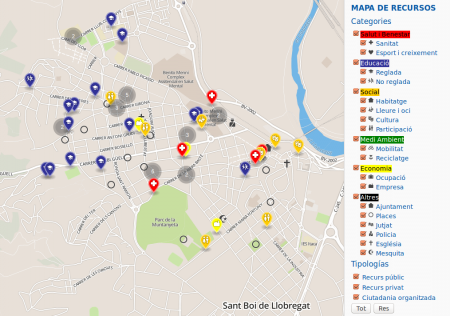
Esta basado en Leaflet utilizando Mapbox como proveedor del mapa. El filtro de categorías esta escrito en Javascript y alimentado directamente desde una hoja cálculo de Google Drive. Los iconos están son del fantastico Maki icon set y renderizado utilizando el plugin de Leaflet MakiMarkers.
Aquí puedes probar el mapa.
Tags: leafletjs, mapbox, mapping, Marianao
Posted in maps, software, webdesign | No Comments »
Wednesday, April 2nd, 2014
Die letzten Monate forschte ich zum Thema barrierefreier Karten, Ende Februar reichte ich meine Bachelorarbeit mit dem Titel “Barrierefreier Zugang zu offenen Geodaten unter besonderer Berücksichtigung sehbeeinträchtigter Personen” ein. Hier das Abstract:
Diese Bachelorarbeit untersucht den Zugang zu freien Geodaten für sehbeeinträchtigte Personen. Ausgangspunkt ist die Analyse relevanter Literatur und existierender Projekte zu Barrierefreiheit und digitalen Karten. Darauf aufbauend wurden für eine eingeschränkte Zielgruppe Anforderungen an ein barrierefreies Kartendesign erstellt. Anhand eines Prototypen werden die Möglichkeiten von Zielgruppenprofilen, personalisierbaren Parametern und der textuellen Repräsentation von Geodaten aufgezeigt. Die Umsetzung erfolgte anhand einer Vektorkarte unter Verwendung von Daten aus OpenStreetMap.
Als Teil der Arbeit entwickelte ich einen Prototypen auf Basis der Vektordaten von Openstreetmap. Anstatt der heute im Web üblichen Rasterkarten rendere ich die Daten direkt im Browser, die einzelen Features wie Strassen, Gebäude und Beschriftungen können so von den BenutzerInnen an ihre Bedürfnisse angepasst werden. Eine Kurzbeschreibung der Software findet ihr hier. (more…)
Tags: accessibility, barrierefreiheit, karten, mapping, sehbehinderung, vector map, vektorkarte, visual impairment
Posted in education, software | No Comments »
Friday, March 14th, 2014
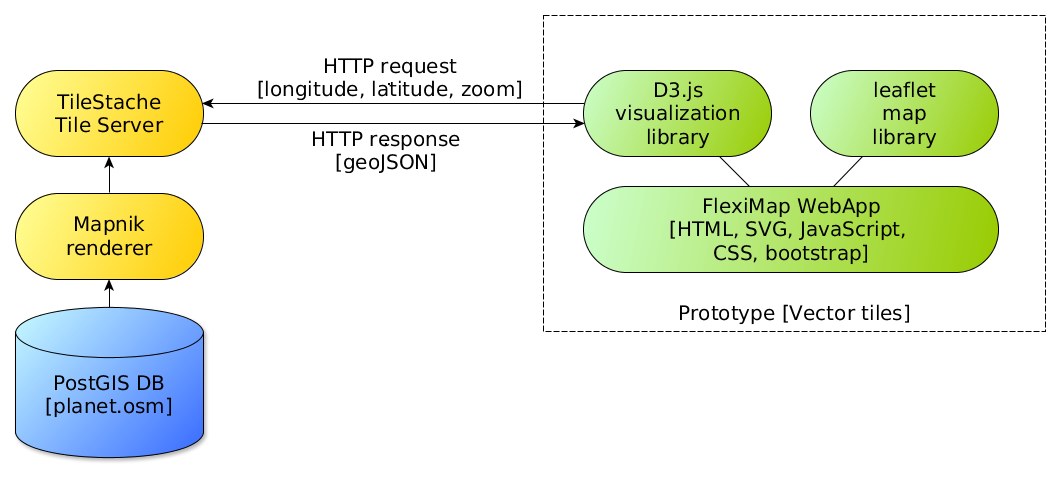
As part of my Bachelor Thesis I investigated accessibility for digital maps from the angle of visual impairment. Taking advantage of characteristics of vector maps, one of the results is a highly customizable map.
 Instead of using pre (server) rendered raster images, the browser itself takes care of rendering vector data which represents the features in the tile. For example roads are sent as LineStrings, buildings, land and water as Polygons and POIs as Points. Javascript based on vector-osm converts them to SVG, the browser takes care of the rendering. Vector tiles are coming from Mapnik Vector Tiles in GeoJSON format using OpenStreetMap as data provider.
(more…)
Tags: accessibility, color blind, mapping, osm, SVG, vector map, visual impairment
Posted in software | No Comments »
Friday, February 28th, 2014
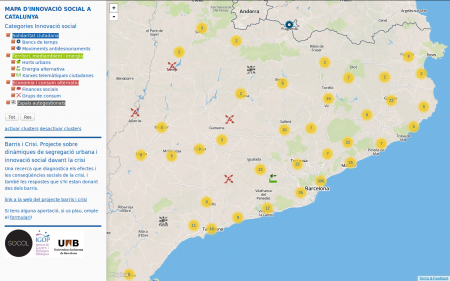
Barris i Crisi means neighbourhoods and crisis in Catalan and is an university project which tries to answer two main aims: Analyse the impact of the crisis on social and spatial inequalities in Catalonian municipalities and their effects on the most disadvantaged neighbourhoods. And secondly, identify responses to this situation by the own neighbourhoods and understand the elements which contribute to the resilience of the communities to the crisis.
(more…)
Tags: Barris i Crisi, barrisicrisi, crisis, crowdsourcing, geojson, IGOP, leafletjs, mapbox, mapping, UAB
Posted in maps, software, webdesign | No Comments »
Sunday, May 26th, 2013
 Linz Pflückt shows more than 2000 public fruit trees in the city of Linz. The basic data comes from the open data portal which was launched as part of the Open Commons Region Linz. The dataset contains information on species, genus, tree height, etc. which we extended with information such as maturity and fruit category.
The fruits of the trees are freely available public domain, which may be picked and eaten by every person! Look at the trees and enjoy the taste of the fruits!
You as fruit fan are invited to evaluate the fruits, comment on the trees and to enrich them with photos. With your submissions, the project is gaining usability and usefulness.
Linz Pflückt is also available as app for Android devices. Owners of other phones can use the mobile version of the website.
The project was built using free software frameworks as OpenStreetMaps, leafletjs and WordPress.
Tags: app, commons, fruits, leafletjs, Linz, mapping, osm, trees, wordpress
Posted in artprojects, hacks, maps, software | 1 Comment »
Tuesday, April 20th, 2010
Art Numerica junto con el Centro Cultural de España organizan estos días un taller de Visualización de Datos. El taller busca introducir a los paricipantes en las estrategias de visualizaciones dinámicas, mezclando investigación, manejo de datos, comunicación y programación. Se dará especial énfasis a proyectos que indaguen en temáticas relacionadas con datos públicos, cultura libre, sistemas de información alimentados colectivamente, captura de datos de fuentes públicas, etc.
Aquí esta el wiki con los recursos del taller y aquí el blog que ha creado Jacob para que nos comuniquemos los avances en cada proyecto.
Tags: chile, infovis, javascript, mapping, processing.org, workshop
Posted in education | No Comments »