Archive for the ‘maps’ Category
Tuesday, September 5th, 2017
QGIS server is a stable and easy to use alternative to geoserver. In this short tutorial you learn how to show your QGIS Desktop project as a online map using QGIS server and OpenLayers. (more…)
Tags: Linux, openlayers, QGIS, tutorial, WMS
Posted in education, maps, software | No Comments »
Saturday, July 8th, 2017
This guide shows the setup of a simple map server with Mapnik 3 and TileStache 1.51.6 using Apache2 on Ubuntu 16.04 Desktop.
Mapnik is a powerful tool for generating maps from geographic data, TileStache a simple vetor and raster tile server for geographic data. (more…)
Tags: Linux, Mapnik, openlayers, TileStache, tutorial
Posted in education, maps, software | No Comments »
Monday, July 4th, 2016
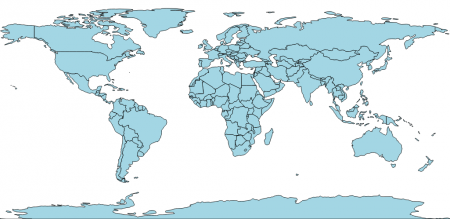
The Historic Charter of Barcelona is a tool to explain the history of the city through the cartographies that describe it. It contains 26 maps that have been drawn from texts, historical cartographies, archaeological maps, modern cartography and contemporary digital maps. A committee of historians specialized in the various historical eras have cross-checked and corrected the documents under the direction of the Barcelona City History Museum (MUHBA).
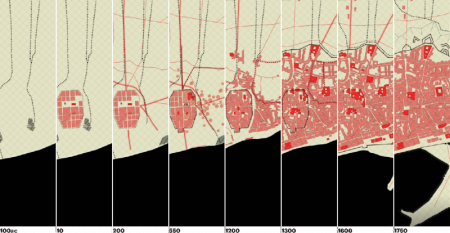
The project was done by 300.000 km/s, my part was the configuration of the mapping server and the programming of the web front end. The backend consists of Mapnik rendering map tiles which get served by TileStache. On the frontend we are running OpenLayers using raster tiles but also geojson layers. (more…)
Tags: 300000kms, Barcelona, history, javascript, Mapnik, mapping, MUHBA, openlayers, TileStache
Posted in education, maps, software | No Comments »
Saturday, February 20th, 2016
The report The digital divide in the city of Barcelona describes Barcelonans ICT access, use, and the quality of their use. It was put out by the Mobile World Capital Foundation at the request of the Barcelona City Hall, in an effort to detect disparities between districts.
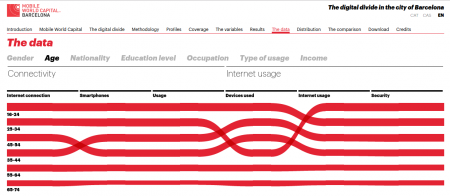
Factors such as age, education, income level and employment impact the way information and knowledge are accessed, giving rise to what has been called the “digital divide.” Specifically, the digital divide refers to the inequality between those who have access to knowledge via new technologies, and those without it. (more…)
Tags: 300000kms, Barcelona, brecha digital, d3js, digital divide, escletxa digital, infovis, MWC
Posted in dataviz, maps, software | No Comments »
Friday, February 5th, 2016
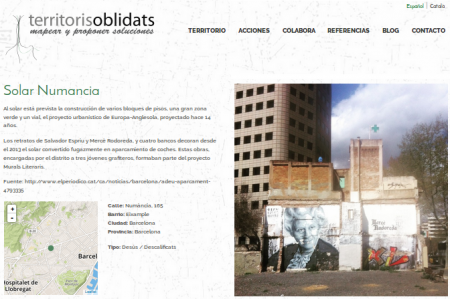
Territoris Oblidats trabaja la sostenibilidad y la accesibilidad urbana. Quiere repensar el diseño urbano para el uso de las personas. Su web presenta experiencias de áreas en desuso en Barcelona, a través de este formulario se puede anadir nuevos territorisos. La web y el backend del mapa estan basada en WordPress, el mapa utiliza Leaflet.js.
Tags: crowdsourcing, leafletjs, mapping, wordpress
Posted in maps, software, webdesign | No Comments »
Sunday, December 6th, 2015
On December 1st we presented crimenesdeodio.info, a memory of 25 years of oblivion. It’s the result of a year long research into deaths caused by hate crimes in Spain. The websites lists 86 cases with a total amount of 88 homicides categorized as Homophobia, Ideological hatred, Islamophobia, Racism and xenophobia, Violence ultra football, Antisemitism, Misogyny, etc.
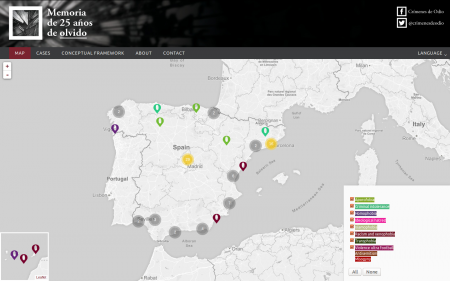
We run on WordPress and developed three plugins and a child theme which are available as free software. So it should be easy to set up your own website for mapping hate crimes or similar geolocated registers. (more…)
Tags: crímenes de odio, GPL, hate crimes, javascript, leafletjs, wordpress
Posted in maps, software | No Comments »
Thursday, June 12th, 2014
Utilizando los scripts desarrollados para Barris i Crisi, monté un mapa de recursos para la Fundación Marianao en Sant Boi de Llobregat. El mapa muestra los recursos del barrio clasificado por diferentes categorías como educación, social o salud y bienestar.
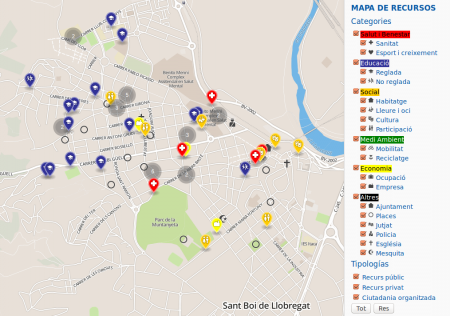
Esta basado en Leaflet utilizando Mapbox como proveedor del mapa. El filtro de categorías esta escrito en Javascript y alimentado directamente desde una hoja cálculo de Google Drive. Los iconos están son del fantastico Maki icon set y renderizado utilizando el plugin de Leaflet MakiMarkers.
Aquí puedes probar el mapa.
Tags: leafletjs, mapbox, mapping, Marianao
Posted in maps, software, webdesign | No Comments »
Friday, February 28th, 2014
Barris i Crisi means neighbourhoods and crisis in Catalan and is an university project which tries to answer two main aims: Analyse the impact of the crisis on social and spatial inequalities in Catalonian municipalities and their effects on the most disadvantaged neighbourhoods. And secondly, identify responses to this situation by the own neighbourhoods and understand the elements which contribute to the resilience of the communities to the crisis.
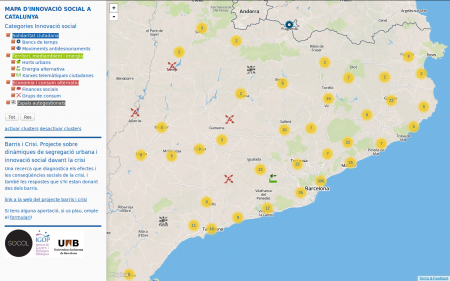
(more…)
Tags: Barris i Crisi, barrisicrisi, crisis, crowdsourcing, geojson, IGOP, leafletjs, mapbox, mapping, UAB
Posted in maps, software, webdesign | No Comments »