SVG with Processing for mapping data
 For casastristes.org we are making different visualizations of the housing situation in Spain. Also Java is a pain in the ass on the web, in two of them we are using Processing comparing new inhabitants with newly constructed houses and free real estates per provinces. In the following article I show the advantages of using SVG graphics when mapping information.
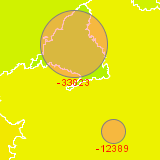
The following example shows the price per square meter in Spanish autonomous communities in 2007 (the more darker the more expensive):
Using Candy SVG Import library makes it easy to import and draw SVG files. I used this Wikipedia file, edited it with Inkscape and used ignoreStyles(); for allowing Processing to use its own fill and stroke colors.
To separate data from view I used this text file to get the values of housing prices, stored them into an array and applied them as fill color into each SVG object.
Here is the source code, the code of the more advances examples I’m going to publish soon on casastristes.org.
Tags: casastristes, infovis, mapping, processing.org, SVG
