Posts Tagged ‘javascript’
Monday, July 4th, 2016
The Historic Charter of Barcelona is a tool to explain the history of the city through the cartographies that describe it. It contains 26 maps that have been drawn from texts, historical cartographies, archaeological maps, modern cartography and contemporary digital maps. A committee of historians specialized in the various historical eras have cross-checked and corrected the documents under the direction of the Barcelona City History Museum (MUHBA).
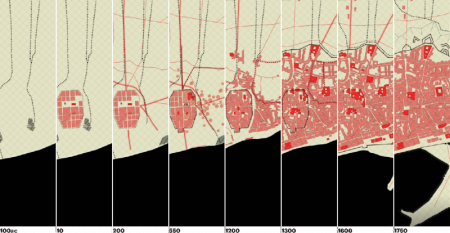
The project was done by 300.000 km/s, my part was the configuration of the mapping server and the programming of the web front end. The backend consists of Mapnik rendering map tiles which get served by TileStache. On the frontend we are running OpenLayers using raster tiles but also geojson layers. (more…)
Tags: 300000kms, Barcelona, history, javascript, Mapnik, mapping, MUHBA, openlayers, TileStache
Posted in education, maps, software | No Comments »
Sunday, December 6th, 2015
On December 1st we presented crimenesdeodio.info, a memory of 25 years of oblivion. It’s the result of a year long research into deaths caused by hate crimes in Spain. The websites lists 86 cases with a total amount of 88 homicides categorized as Homophobia, Ideological hatred, Islamophobia, Racism and xenophobia, Violence ultra football, Antisemitism, Misogyny, etc.
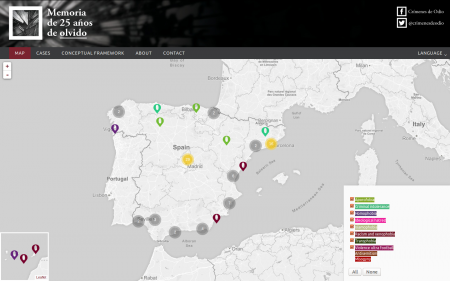
We run on WordPress and developed three plugins and a child theme which are available as free software. So it should be easy to set up your own website for mapping hate crimes or similar geolocated registers. (more…)
Tags: crímenes de odio, GPL, hate crimes, javascript, leafletjs, wordpress
Posted in maps, software | No Comments »
Monday, March 30th, 2015
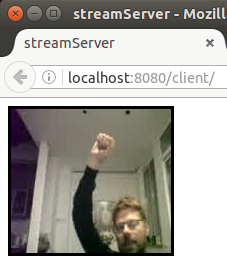 The last months we (with Sergi Lario) had some fun implementing a GUI to control a media server done by playmodes. We used web technologies and had the need to stream the content of the media server to our app. This article gave us the inspiration about how to easily stream video from ffmpeg to HTML5 canvas.
In resume, data gets streamed from ffmpeg through web sockets and is received frame by frame as Motion JPEG. Then we encoded the images as Base64, sent them over web sockets to the frontend and draw them to HTML. (more…)
Tags: canvas, ffmpeg, HTML5, javascript, nodejs, socket.io, stream, video
Posted in hacks, software | 3 Comments »
Friday, August 10th, 2012
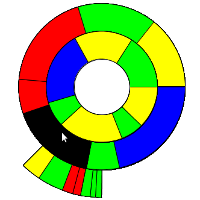 I was always a big fan of Ring Charts, also known as Multi-level Pie Charts or Radial Treemap, specially the Baobap disk allocation program for Linux, developed by Igalia. Now I want to start to use them for other kind of visualizations as an alternative to treemaps. I didn’t find any implementation in Javascript so I started to develop one on my own using Processing and it’s Processing.js exporter. The design of the classes was inspired by this Java Ring Chart implementation.
Some characteristics of this class: It’s size and the thickness of the rings adapt dynamically to the container. The rings can start and end at any angle. The segments of each ring are divided proportionally based on the segments value and drawn to the proper arc length based on the start and end angle.
You can download the sources at OpenProcessing, what follows is a description of the classes ArcSegment, Ring and RingChart.
(more…)
Tags: infovis, javascript, Multi-level Pie Chart, processing.js, processing.org, radial treemap, ring chart, rings chart
Posted in software | No Comments »
Monday, April 16th, 2012
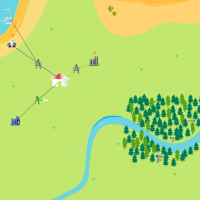 Bajo este título desarrollamos para el Museu de la Ciència i de la Tècnica de Catalunys un proyecto online sobre ciudad y sostenibilidad. En la web labonavida.cat encontrarás mucha información acerca de ámbitos temáticos como Energía, Consumo, Agua y Mobilidad.
El nuclea del proyecto son cuatro juegos online conectados por un metajuego. Hoy lanzamos el primer juego, Shine-City, donde tienes que crear la red energética para alimentar una ciudad con suficiente energía. Cada semana sumamos un juego, el próximo lunes Fast-food, después Recicletris y cerramos con Sokollapso.
¡A jugar!
Tags: ciudad, HTML5, javascript, juego, labonavida, sostenibilidad
Posted in education, software | No Comments »
Monday, April 16th, 2012
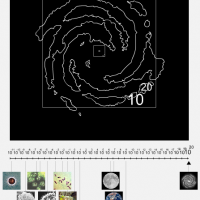 Bajo este nombre críptico habrá un taller en el Festival Internacional de la Imagen en Manizales/Colombia. El taller tiene como objetico familiarizar a los participantes en la programación JavaScript/HTML5 utilizando los ejemplos “De Gaia al microcosmos” como base práctica. La primera parte del taller será una introducción práctica al elemento Canvas de HTML5 y a las capacidades y particularidades de Processing para la programación web. En la segunda parte se formaran grupos de los cuales cada uno analizará uno de los 7 ejemplos de GAIA o uno de sus componentes comunes.
El proyecto “De Gaia al microcosmos” busca transformar, actualizar y localizar culturalmente materiales educativos desarrollados por Lynn Margulis mostrando interrelaciones biológicas y geológicas que ocurren desde el universo molecular al universo cósmico. Ha sido iniciado en el 2005 por Lynn Margulis, Santiago Ortiz y Luis Rico.
Como siempre podrás encontrar los apuntes del taller en mi wiki educativo.
Tags: gaia, HTML5, javascript, Lynn Margulis, processing.js, processing.org
Posted in artprojects, education, software | No Comments »
Sunday, February 26th, 2012
Recently I converted some Processing sketches to Processing.js using Processing 2.0a4 Pre-Release with integrated Javascript mode. In resume it’s quite straight forward, they did a great job. But I had some troubles with code that works fine in Processing but not when exported to Javascript.
Sometimes it’s quite hard to detect errors yet the applet gets exported without error messages and shows up in the browser as an empty canvas. It’s recommended to use Firebug and Chrome javascript console Javascript console in parrallel as sometimes one gives a better description than the other. But sometimes none of them shows an error so it’s quite impossible to debug the sketches. (more…)
Tags: javascript, processing.js, processing.org
Posted in software | 7 Comments »
Tuesday, April 20th, 2010
Art Numerica junto con el Centro Cultural de España organizan estos días un taller de Visualización de Datos. El taller busca introducir a los paricipantes en las estrategias de visualizaciones dinámicas, mezclando investigación, manejo de datos, comunicación y programación. Se dará especial énfasis a proyectos que indaguen en temáticas relacionadas con datos públicos, cultura libre, sistemas de información alimentados colectivamente, captura de datos de fuentes públicas, etc.
Aquí esta el wiki con los recursos del taller y aquí el blog que ha creado Jacob para que nos comuniquemos los avances en cada proyecto.
Tags: chile, infovis, javascript, mapping, processing.org, workshop
Posted in education | No Comments »


 The last months we (with


